Riverside Waste Transfer Station
Moving Contour Lines
| Next | Images | Chronology | Latest News |
| Here again is the plan prepared by SK Design Group for their client Valley Mill Corporation. The map was submitted to the Massachusetts Executive Office of Environmental Affairs as part of SK Design Group's Environmental Impact Report. | 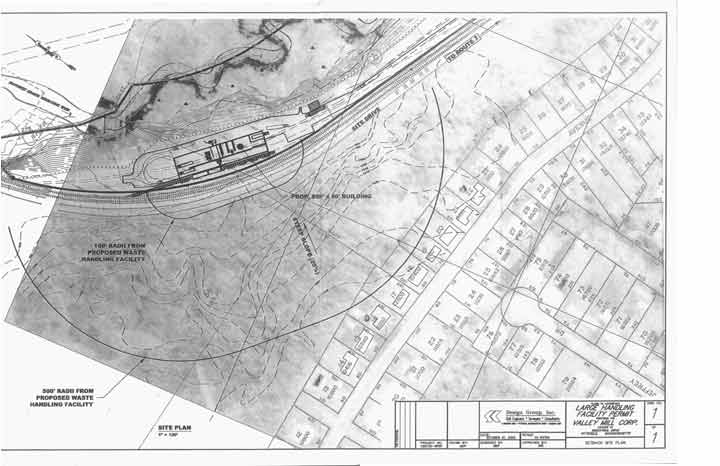 |
| Here BEAT has zoomed in on a different part of the plan, this time looking at the contour lines. Since there had not been a survey of the property at the time this map was created, we used the City of Pittsfield's Topographic Survey to check the contours. We feel this is actually the most likely source of the topographic data on SK Design's plan. The contour lines below the railroad tracks on the image have a five foot contour interval. This is the same contour interval that is used on the City of Pittsfield survey. The contour lines above the railroad tracks in the image show a one foot contour interval. Where did this additional resolution come from? The unnatural straightness and angularity (red arrows) of the lines above the railroad tracks suggest that these lines are computer generated interpolations. Interpolation would suggest detail that does not exist in the original data. | 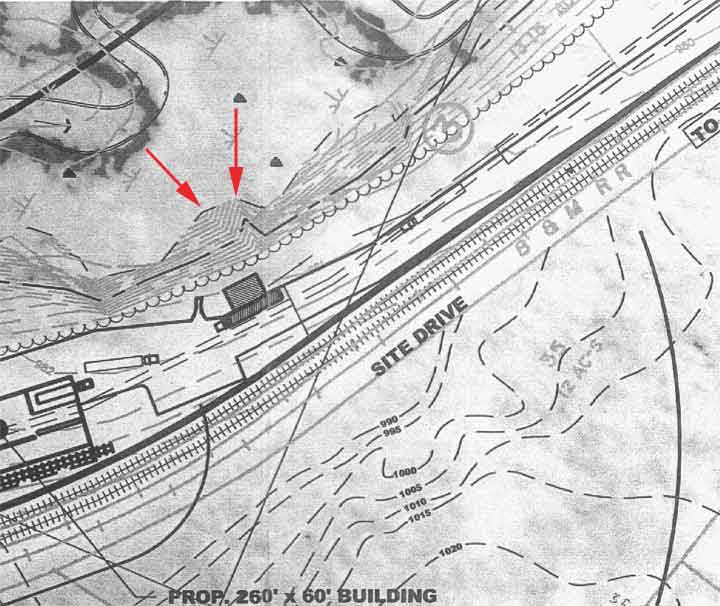 |
|
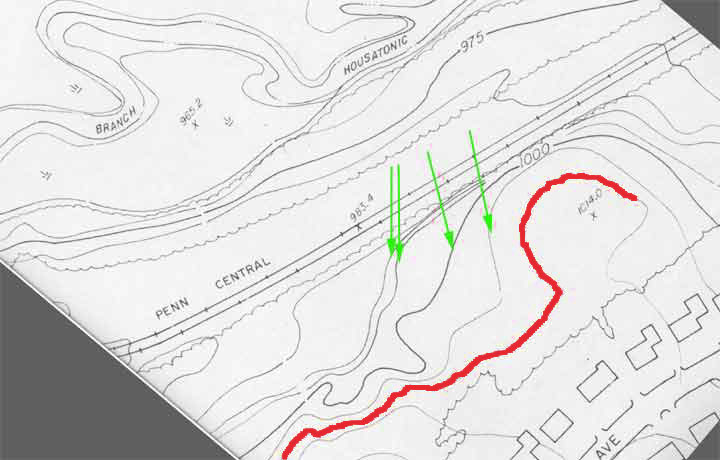
City of Pittsfield Topographic Survey (Map G6) |
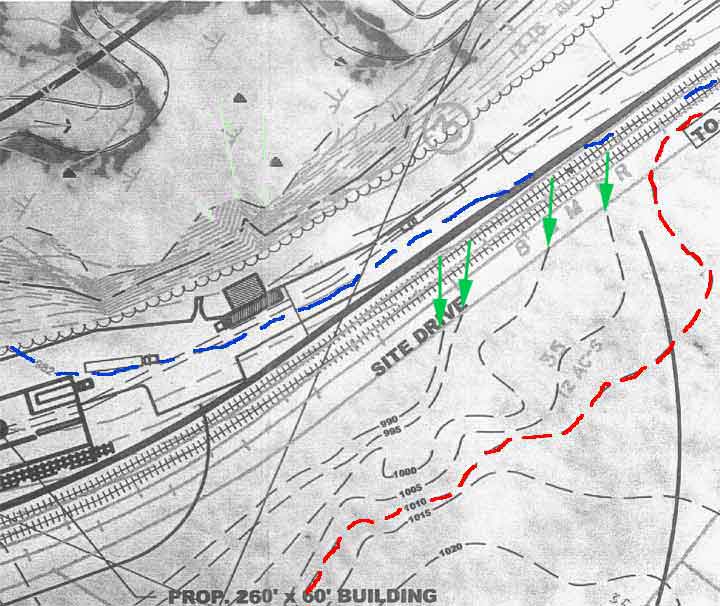
SK Design Plan |
|
Above, the image on the left is part of the City of Pittsfield Topographic Survey, Map G6, available from the City of Pittsfield's Engineering Department. On both plans we have outlined the 1010' contour in red (solid on the City's topographic survey - dashed on SK Design Group's plan). Notice on each plan, the distance from this contour line to the railroad tracks. Notice also the contour lines indicated by the four green arrows. These contour lines on the SK Design Group's plan end as they approach the railroad tracks. (See tutorial on Topographic Maps) Notice these contour lines do not end on the City's topographic survey. |
|